Adapting Schedules Using Predictive Analytics for Timely Departures
Predictive analytics is changing how operators plan departures and manage assets across mobility networks. By combining historical performance, real-time telemetry, and contextual signals, transport planners can adjust scheduling to reduce delays for commuting, flights, rail, buses and rideshare services. This article outlines practical approaches and considerations for applying predictive models to everyday travel operations.

Predictive analytics offers transport operators a way to adapt schedules and improve the probability of timely departures by anticipating disruptions before they occur. Combining data from traffic, vehicle telemetry, passenger loads, weather, and operational constraints creates models that inform scheduling decisions across airports, rail stations, bus depots, and rideshare fleets. Effective implementations focus on measurable improvements to itinerary reliability, navigation of contingencies, luggage handling flows and fare-aware routing without overpromising outcomes.
How does predictive scheduling improve mobility?
Predictive scheduling enhances overall mobility by identifying patterns that precede delays and by suggesting proactive adjustments. For example, models that detect recurring bottlenecks at interchange nodes can shift departure windows or reallocate rolling stock to maintain headways. On-demand mobility benefits when predictive demand forecasting aligns rideshare availability with peak commuter flows, reducing deadhead mileage. Integrating these insights into dispatch and control systems helps maintain smoother transfers between modes and reduces variability that undermines passenger confidence in public and shared transport.
How can predictive analytics reduce commuting delays?
Commuting relies on dependable timetables; predictive analytics reduces commuter delay by forecasting issues such as congestion spikes, track maintenance impacts, or vehicle availability. Planners can use short-term demand predictions and live navigation feeds to alter departure spacing, add supplemental shuttle services, or advise passengers on alternative itineraries. Communication systems that convey expected wait times and luggage handling guidance can give commuters clearer expectations, improving perceived reliability even when minor adjustments are necessary for safe, timely departures.
How are flights and airports affected by predictive schedules?
Airports and airlines use predictive models to anticipate gate conflicts, runway throughput reductions, and security queue surges. These forecasts inform dynamic scheduling of boarding windows, ground handling crews, and connections between flights. Predictive analytics can also help optimize luggage routing by identifying potential chokepoints in baggage handling that could delay departures. While air traffic control and regulatory constraints limit some interventions, better coordination among operations, navigation services, and ground handlers increases the likelihood of on-time departures and smoother itineraries for passengers.
How can rail and buses benefit from predictive forecasts?
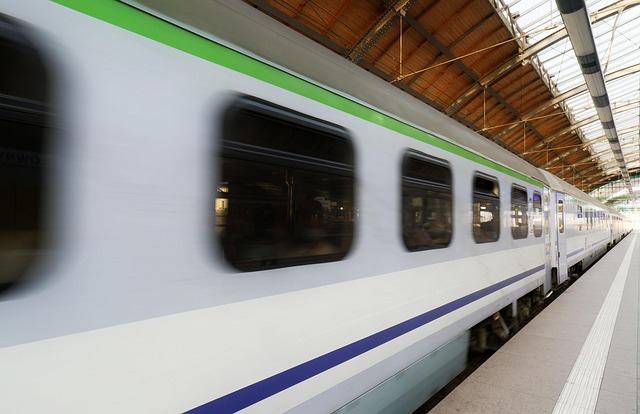
Rail and bus operators gain from analytics that forecast vehicle arrival variance, platform crowding, and route-level traffic conditions. For rail, predictive maintenance signals reduce the chance of in-service failures that delay departures; for buses, real-time traffic and fare-household demand models help re-sequence trips or deploy reserve vehicles. Scheduling adjustments guided by these models can preserve timetable integrity, improve boarding flows for passengers with luggage, and make fares and connections more predictable across multi-leg commutes.
How does rideshare integrate with predictive itineraries?
Rideshare platforms use predictive analytics to match supply with near-term demand while minimizing detours and wait times. Integrating rideshare predictions with public transit schedules enables last-mile coordination—drivers are positioned near anticipated commuter exits or station drop-off points, improving connection reliability. When navigation systems incorporate predicted congestion and airport pickup rules, routing for drivers accounts for potential boarding delays and luggage loading times, resulting in departures and meetups that align better with passengers’ itineraries.
| Product/Service | Provider | Cost Estimation |
|---|---|---|
| Rideshare (short urban trip) | Uber | Typical fare range: $5–$25 depending on distance, time, and surge pricing |
| Intercity rail (short to medium distance) | Amtrak (US examples) | Typical ticket range: $20–$100+ depending on route and advance purchase |
| Intercity bus | Greyhound | Typical fare range: $10–$60 depending on distance and flexibility |
| Domestic economy flight (point-to-point) | Major carriers (example) | Typical fare range: $50–$300+ depending on season, advance booking, and route |
Prices, rates, or cost estimates mentioned in this article are based on the latest available information but may change over time. Independent research is advised before making financial decisions.
Conclusion Predictive analytics offers a practical route to adapting schedules across mobility modes, from commuting and transit to flights and rideshare. By combining historical patterns with live navigation, operational telemetry, and passenger itinerary data, operators can make informed scheduling choices that reduce delays and align fares, luggage handling and transfers with realistic expectations. Continuous model validation and transparent communication remain essential for predictable departures and resilient transport operations.


